Have your groceries really become more expensive? Why your own monthly comparison matters
Inflation, individual product prices and your personal shopping routine do not always tell the same story. Your own receipts can provide the more useful comparison.
20 August 2026 · 7 min read · BonBert RedaktionHave your groceries really become more expensive?
“My shopping somehow seems to get more expensive every month.”
It is an easy feeling to recognise.
The basket looks roughly the same. You still buy the usual milk, coffee and household items – yet the total at checkout seems higher.
But is it really?
That question is harder to answer than simply looking at the latest inflation rate.
Because general inflation, individual food prices and your own monthly spending are three different things.
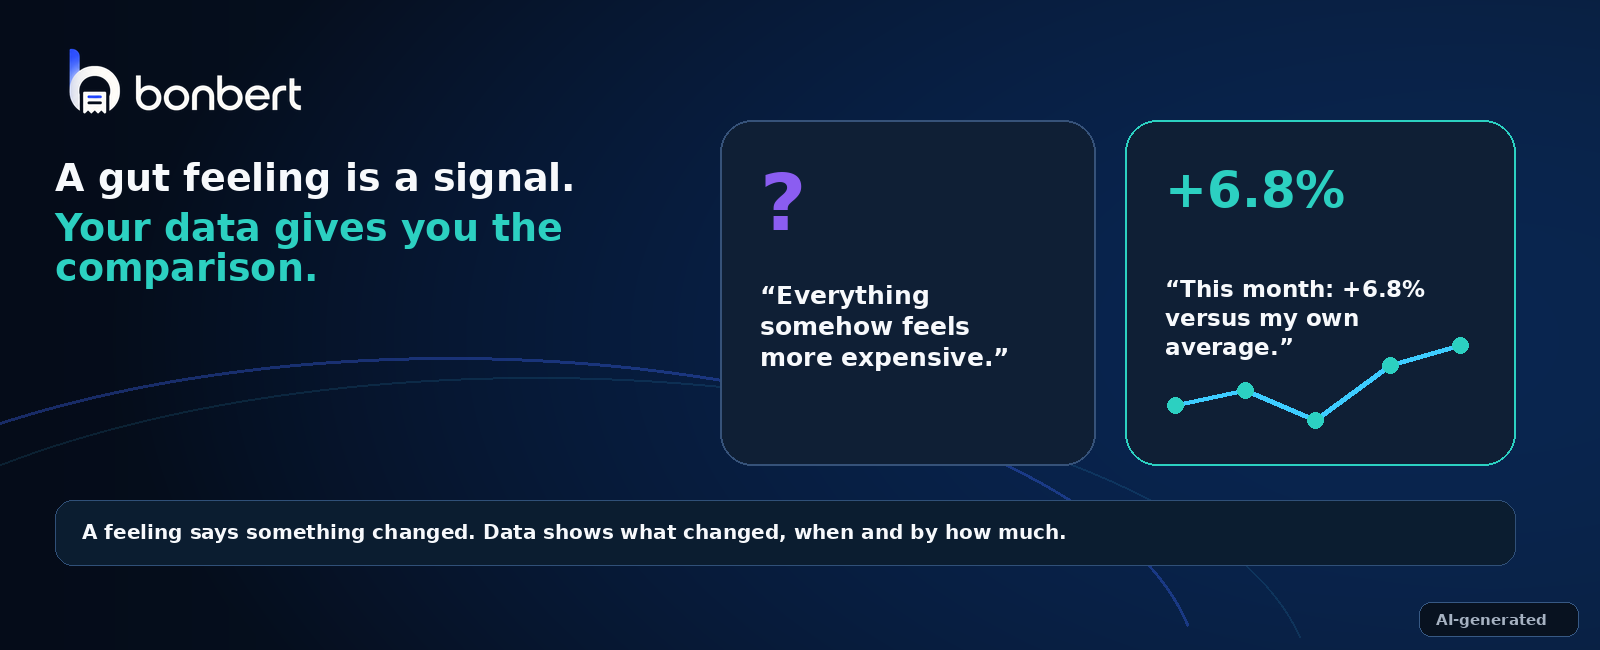
A feeling can signal that something changed. Your own data shows how large that change actually is. Image: AI-generated.
Inflation is not your personal receipt
Germany's provisional inflation rate for July 2026 was +2.8% year on year, according to the Federal Statistical Office.
That does not mean your weekly grocery shop automatically became 2.8% more expensive.
The Consumer Price Index includes a huge range of everyday expenses, not just groceries.
It covers housing, energy, transport, services, clothing, leisure and many other goods and services.
For your grocery shop, food-specific price movements are more relevant.
In June 2026, food prices overall were only 0.4% higher than in June 2025.
That sounds like a very small change.
But even that figure tells only part of the story.
An average can hide large differences
Individual food prices moved very differently in June 2026.
According to Destatis, for example:
- butter was 29.1% cheaper than a year earlier
- eggs were 14.6% more expensive
- coffee and similar products were 5.6% more expensive
At the same time, food overall was only 0.4% above the previous year's level.
That is not a contradiction.
It simply shows how averages work.
Some products become cheaper while others become more expensive, and those different movements eventually form an average.
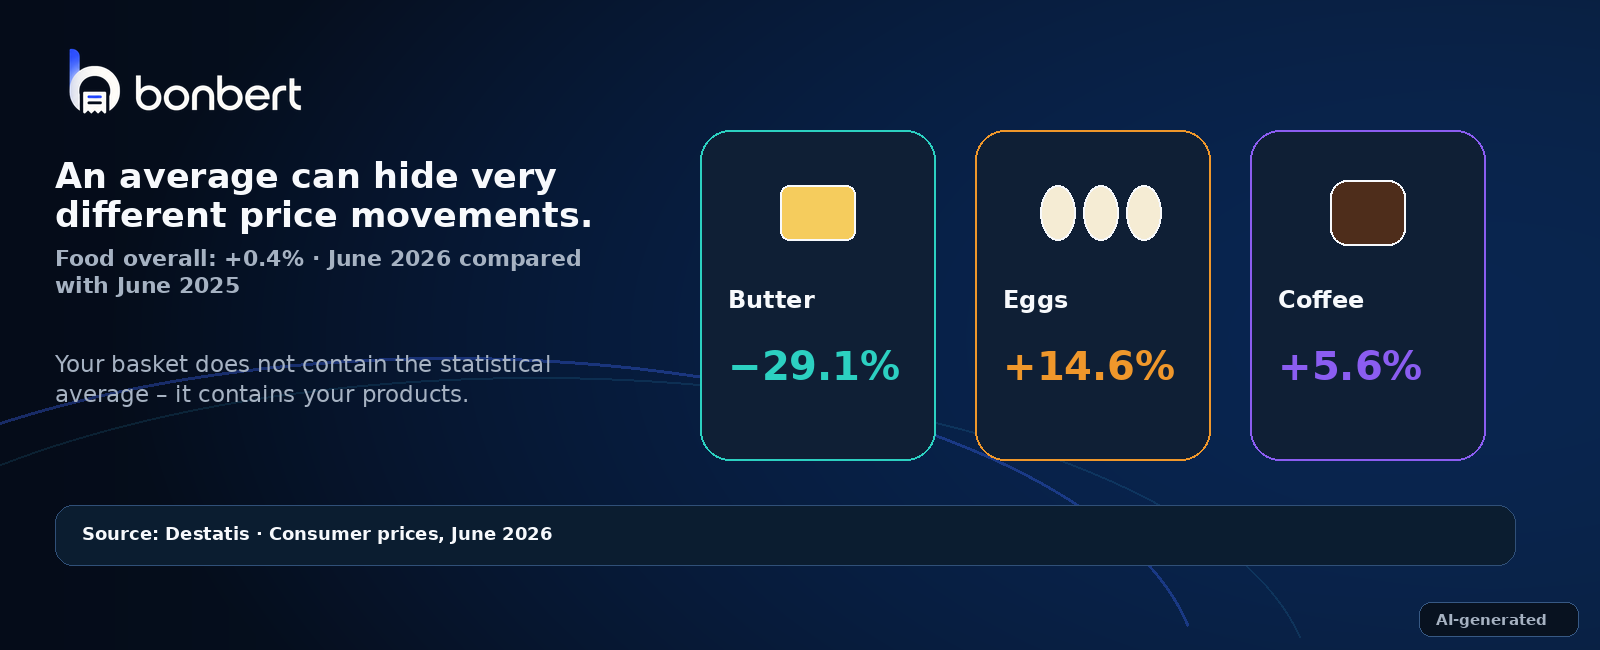
A low average does not mean every product moved in the same direction. Source for the shown rates: Destatis, June 2026. Image: AI-generated.
Your basket is not the statistical average
Perhaps you rarely buy butter.
But eggs go into your basket every week.
Or perhaps you buy a lot of coffee.
In that case, your own grocery costs can rise considerably more than the average food-price figure suggests.
Another household may experience the exact opposite.
Inflation is therefore extremely useful for understanding the general price level of an economy.
But it does not automatically answer the personal question:
“How have my own shopping costs changed?”
Spending more does not automatically mean prices increased
Imagine your spending looks like this:
| Month | Spending |
|---|---|
| May | €302 |
| June | €321 |
| July | €318 |
| August | €337 |
At first glance, spending increased by around 11.6% between May and August.
But does that mean groceries became 11.6% more expensive?
No.
You might have been shopping for more people, stocked up on pantry items, cooked at home more often, eaten out less frequently or simply bought different products.
A receipt therefore contains more than prices.
It also contains quantities, products, categories and shopping behaviour.
The most useful comparison often starts with yourself
Your own average can therefore be one of the most useful benchmarks.
If your normal monthly grocery spending tends to sit between €300 and €320, a month at €390 immediately stands out.
The interesting question is then no longer:
“What is the inflation rate?”
It becomes:
“What was different this month?”
Perhaps one category changed. Perhaps you shopped more often. Perhaps one recurring product became noticeably more expensive. Or perhaps it was simply a larger stock-up purchase.
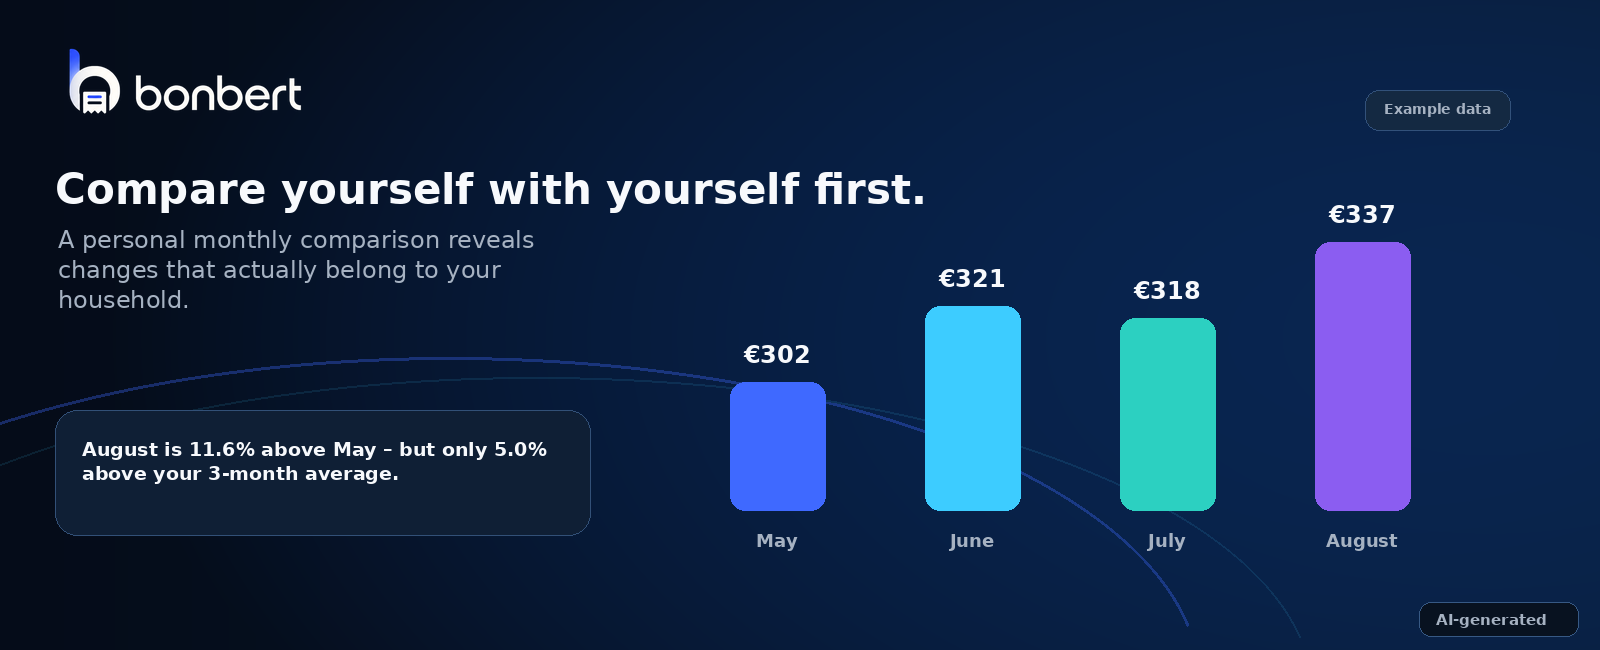
Your own trend can be a more relevant benchmark than a general average. Monthly values shown are fictional examples. Image: AI-generated.
One month versus another is not always enough
Even a personal comparison needs some context.
Comparing July directly with August can be useful.
But looking across several months can often be more reliable.
One month can be unusual because of guests, holidays or a larger stock-up shop.
A three- or six-month average can therefore provide a more stable baseline.
That makes it easier to distinguish a genuine trend from one unusual month.
Categories make changes easier to understand
The comparison becomes even more useful when you look beyond the total amount.
Imagine your monthly spending increases by €30.
That might consist of:
- groceries +€5
- drinks +€2
- drugstore +€23
In that situation, saying “food keeps getting more expensive” may not actually describe what happened.
Categories show where the change came from.
That is why a bank transaction is often too broad.
Your bank statement only says:
Supermarket – €78.40
Your receipt shows what is behind that €78.40.
Receipts make personal comparisons possible
One receipt tells you very little about a trend.
Many receipts can create structure:
Receipt → products → categories → weeks → months → trends
Individual shopping totals gradually become a personal history.
That can help reveal which categories affect your budget most, whether you are shopping more frequently, whether recurring products are changing in price and whether one month is unusual.
BonBert builds that shopping history from your receipts
BonBert captures your receipts and structures retailers, products, prices, quantities and categories.
That allows your shopping to be viewed over time.
The statistics view shows spending across weeks, months and years and helps identify which categories account for a larger share of your budget.
BonBert should therefore do more than tell you:
“You spent €337 this month.”
The context is more useful:
- Is that above your usual level?
- Which category changed?
- Were there unusual purchases?
- Do certain patterns keep appearing?
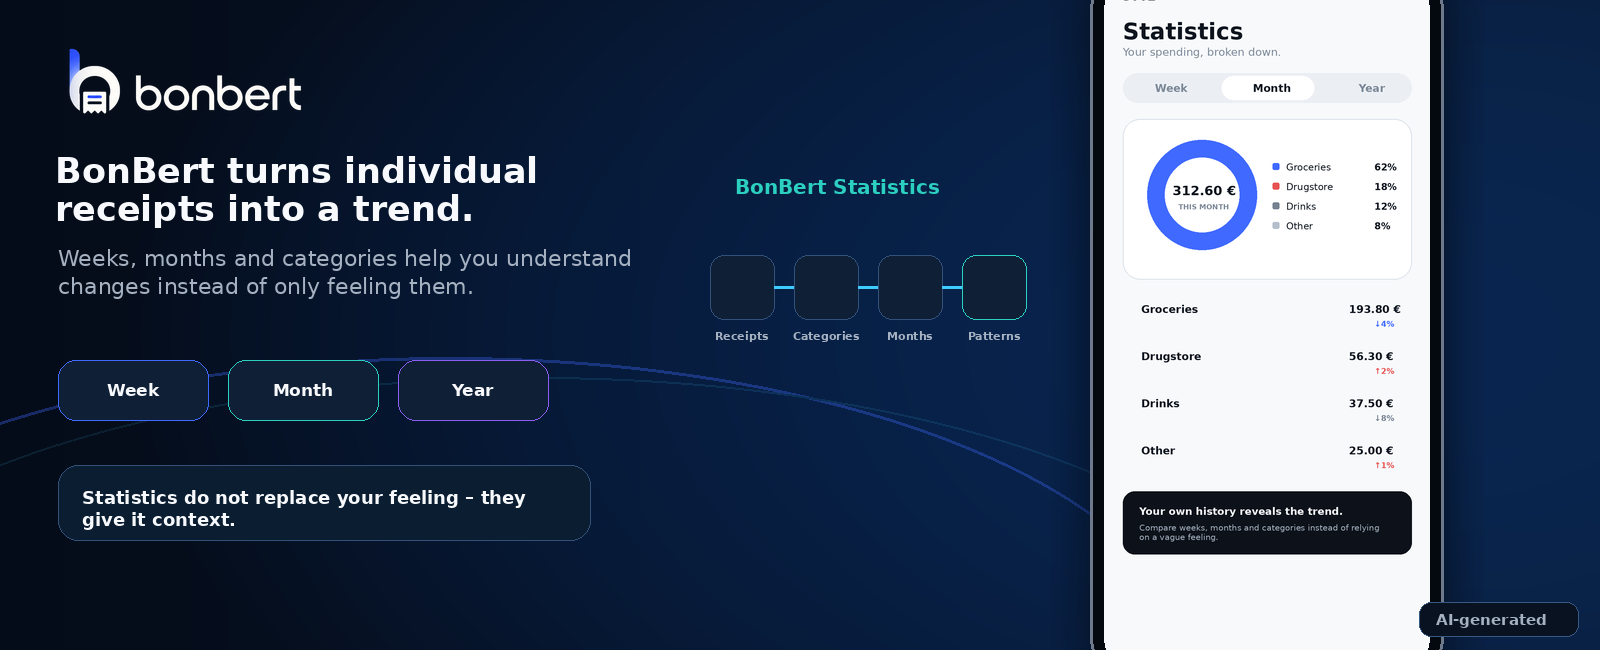
BonBert turns individual receipts into a personal spending and shopping history. AI-generated composition based on BonBert's app design.
Your personal trend is not an inflation measure
BonBert does not measure official inflation.
Official inflation requires statistical methods and broad representative baskets such as the Consumer Price Index.
BonBert looks at something else:
your shopping.
That is not a macroeconomic measure.
But for personal household budgeting, it can be the more useful perspective.
Because you probably do not only want to know how prices are moving on average.
You want to know:
What is happening to my budget?
What a good monthly comparison can teach you
A useful personal comparison can help separate three different effects:
1. Prices change
The same product costs more or less than before.
2. Your shopping behaviour changes
You shop more frequently, buy larger quantities or choose different products.
3. Your household changes
More people, different eating habits or new routines can change your budget.
All three can make monthly spending rise.
But they require different responses.
Higher spending is not automatically a problem
If your grocery spending rises because you order less takeaway and cook more often, your supermarket total can increase while your total food spending actually falls.
A higher number is therefore not automatically bad.
It needs context.
And that context only appears when shopping is viewed as more than a series of isolated transactions.
Conclusion: your own comparison answers your own question
Official inflation data matters.
It tells us how the general price level is developing.
But it cannot know which products you buy, how often you shop or how your household changes.
That means the question “Have my groceries really become more expensive?” cannot be answered by inflation alone.
A useful starting point is often:
- your own previous months
- your categories
- your recurring products
- your actual receipts
Perhaps your shopping really has become more expensive.
Or perhaps you are simply shopping differently.
The difference is in your receipts.
More from BonBert
→ How much do households in Germany spend on groceries?
→ Why the cheapest supermarket isn't always the cheapest for you
→ Why BonBert sometimes takes a few extra seconds to scan a receipt
Sources
German Federal Statistical Office (Destatis), Consumer Price Index: https://www.destatis.de/EN/Themes/Economy/Prices/Consumer-Price-Index/_node.html
Destatis, “Inflation rate at +2.3% in June 2026”, 10 July 2026: https://www.destatis.de/DE/Presse/Pressemitteilungen/2026/07/PD26_243_611.html
Destatis, “Inflation rate of +2.8% expected in July 2026”, 30 July 2026: https://www.destatis.de/EN/Press/2026/07/PE26_270_611.html
BonBert product page: https://www.bonbert.de/en
Personal monthly figures and household examples in this article are illustrative examples and are not official statistics.
AI notice: AI-generated or AI-composed images used in this article are visibly labelled.